Educational content only. Not financial advice. Always do your own research. See full Disclaimer.
Some mornings the market is already decided before the opening bell. Futures are flat, nobody is trading, and then a single number lands and everything reprices at once. Bonds move, the dollar moves, and stocks gap open in a direction that sometimes makes no sense given what the number said.
That number is usually the CPI report, the monthly reading on US consumer inflation. It is one of the few scheduled releases that can move the whole market rather than a single company, and it does not require an economics degree to understand. You need to know what it measures, how it reaches a share price, and why the reaction depends on expectations rather than on the level of inflation itself.
What the CPI report actually measures
CPI stands for Consumer Price Index. It is produced by the Bureau of Labor Statistics, a US government agency, and it tracks the average change in prices paid by urban consumers for a basket of goods and services: groceries, rent, gasoline, medical care, airfares, used cars, and much more.
The index itself is just a level. What gets reported and traded are the changes in it, and they come in two flavors that are easy to mix up:
- Month over month. How much prices moved since the previous month. This is the fresher signal and the one that tends to drive the immediate reaction.
- Year over year. How much prices moved compared with the same month a year earlier. This is the figure quoted in headlines as "inflation is running at x percent."
Those two can tell different stories in the same report. Year over year inflation can fall while monthly prices are accelerating, simply because of what the comparison month a year ago looked like. When a headline and a market reaction seem to disagree, this is often why.
How often it comes out, and where to check
CPI is a monthly release, so there are twelve of them a year, and each one covers the previous month. It comes out in the morning, before the US market opens, which is why so much of the reaction shows up as a gap in the opening price rather than as a move you can watch develop.
The exact dates are published in advance by the agency itself. Read them from the source rather than from a finance blog or a calendar widget: the Bureau of Labor Statistics maintains its official news release schedule, which lists every upcoming release with its date and time.
That habit is worth building. Release dates get copied around the internet, go stale, and quietly turn wrong, and a stale date is how people end up surprised by a report they meant to prepare for.
Headline CPI and core CPI
You will hear two versions of the same report quoted side by side, and the difference matters.
- Headline CPI includes everything in the basket, food and energy included.
- Core CPI strips out food and energy.
Removing food and energy sounds absurd, because those are the prices people actually notice. The reasoning is about signal rather than about what matters to a household. Food and especially energy prices swing hard on weather, harvests and geopolitics, and those swings often reverse within months. Policymakers are trying to read the underlying trend in prices, not the noise on top of it, so core is treated as the better guide to where inflation is heading.
In practice the market watches both, and pays closest attention to core when the two disagree. A hot headline reading driven entirely by a gasoline spike gets discounted far more than the same number coming from rents and services.
Why an inflation number moves stock prices
CPI does not touch any company's earnings on the day it is released. It works through a chain, and every link in that chain is worth knowing because it explains reactions that otherwise look random.
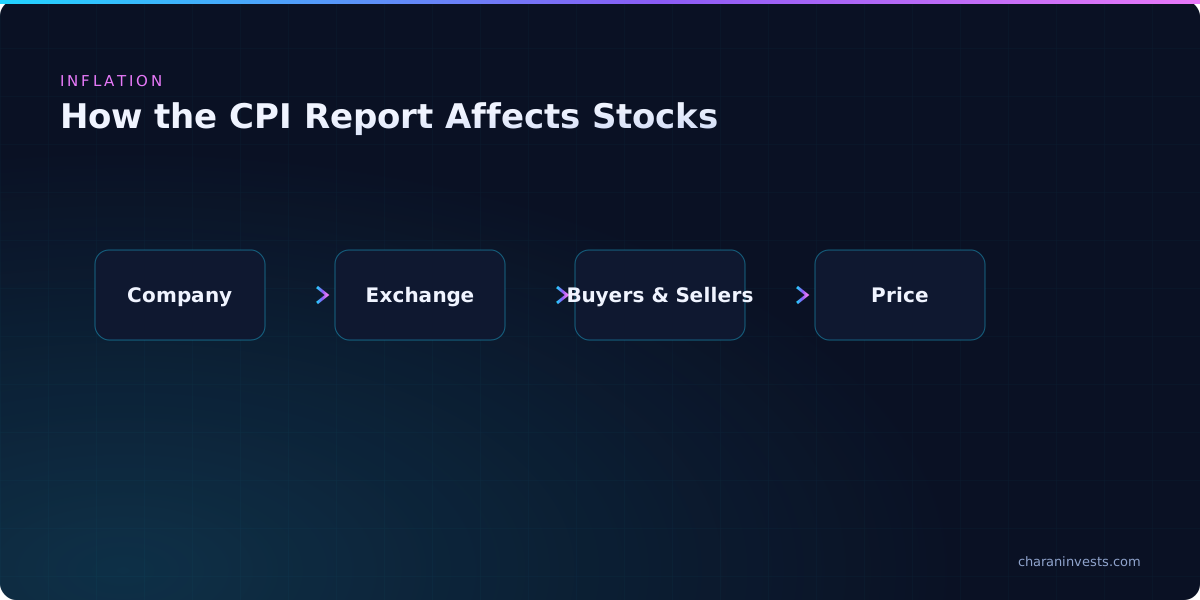
The chain runs like this. Inflation data shapes what the market expects the Federal Reserve to do with interest rates. Rate expectations set bond yields. Bond yields determine how much a dollar of future company profit is worth today. And a share price is essentially the market's estimate of a company's future profits converted into today's money.
- Through Fed policy. Controlling inflation is one of the Fed's mandates. Persistent inflation argues for keeping rates higher for longer, cooling inflation opens the door to cutting. The Fed meeting is where the decision is announced, but CPI is a large part of what the committee is reading between meetings, and the market knows it.
- Through discounting. Higher expected rates shrink the present value of profits arriving years from now. Companies whose value sits mostly in distant future earnings get repriced harder than steady businesses earning cash today.
- Through borrowing costs. Companies finance growth with debt. When the expected path of rates moves up, financing gets more expensive and expansion plans get trimmed.
- Through margins. Rising input costs squeeze profitability unless a company can raise its own prices. The ability to pass costs on to customers is one of the things inflation separates businesses by.
Notice that none of this is a forecast. It describes plumbing. Which way the market goes on any particular release depends on something else entirely.
The surprise is what moves the market, not the level
This is the part that confuses people most, and it is the single most useful idea on this page. Inflation can come in high and stocks can rally. It can come in lower and stocks can fall.
By the time a release arrives, economists have published forecasts, traders have positioned for the most likely outcome, and that expectation is already reflected in current prices. What moves the market is the gap between the consensus forecast and the actual print. A reading that is still historically elevated but came in below what everyone expected is, in market terms, good news.
The market has already traded the number it expected. All that is left to trade is the difference.
If that logic feels familiar, it is the same mechanism behind how earnings affect a stock price, where a company can beat expectations and still sell off. It is also why option prices inflate ahead of a scheduled release and deflate the moment it lands, which is covered in implied volatility and IV crush. Uncertainty has a price, and a known number has no uncertainty left in it.
Why the reaction is often violent and brief
CPI mornings have a particular shape. The initial move happens in seconds, because a great deal of it is automated and because everyone is reacting to the same one number at the same instant. Spreads widen, liquidity thins out, and the first print you see on your screen may not be a price you could actually have traded at.
Then, frequently, it partly unwinds. Traders read past the headline into the detail: which categories drove the change, whether shelter costs are still the main contributor, whether the monthly and annual figures agree. The first reaction trades the headline and the next hour trades the composition, which is why a chart can open sharply one way and close the other.
The practical consequence for a smaller investor is simple. Placing a market order into that window means accepting whatever price the thin book gives you. This is exactly the situation limit orders exist for.
Why different parts of the market react differently
Inflation sensitivity is not spread evenly, and knowing which mechanism applies to something you own is far more useful than trying to guess the print.
- Long-duration growth companies. Value concentrated in profits expected far in the future, so the discounting effect hits hardest.
- Banks and financials. Profitability is tied to the rate environment and the shape of the yield curve, so they often move on rate expectations rather than on inflation itself.
- Companies with pricing power. Businesses that can raise prices without losing customers protect their margins through an inflationary stretch. Ones competing purely on price cannot.
- Rate-sensitive sectors. Housing, construction, utilities and anything carrying a lot of floating rate debt feel changes in borrowing costs quickly.
Working out which bucket a holding sits in is ordinary fundamental analysis. It will not tell you what CPI will print. It will tell you why a stock you own moved when it did, which is a question you can actually answer.
What this means for a beginner investor
If you are still building a foundation, the honest answer is that inflation releases should change very little about what you do. They are loud, and loud is not the same as important for someone investing over years.
- Know the release is coming. Not to trade it, but so a violent morning does not read as a crisis. Checking the agency schedule takes seconds.
- Do not trade the first thirty seconds. Spreads are widest and prices least reliable exactly when the urge to act is strongest.
- Use limit orders around scheduled data. You control what you pay. A market order in a thin book does not.
- Read the composition, not the headline. Which categories moved tells you more than the single percentage everyone quotes.
- Do not build a position on a guess about the print. Forecasting a macro release is a professional activity that professionals frequently get wrong, and sizing matters more than being right. Start with position sizing.
- Separate the economy from the market. They are related and they are not the same thing, which is much of what bull and bear markets is about.
If you want the other half of the picture, the Fed publishes its meeting schedule on the official FOMC calendar, and it notes that future meeting dates stay tentative until they are confirmed. Inflation data between meetings is the input. The meeting is where it becomes policy.
Common mistakes around inflation data
- Assuming high inflation means stocks fall. The market trades the change in expectations, not the level.
- Reading only the year over year headline. It can move for reasons that have nothing to do with current prices.
- Treating one month as a trend. Single readings get revised and reverse. Policymakers look at several months together for exactly that reason.
- Buying options the day before a release. You pay the most inflated premium of the cycle for a move that has to be large just to break even.
- Trusting a release date from a third-party site. Schedules get copied and go stale. The agency publishes its own.
Your next step
Macro data makes far more sense when you watch a few releases land with people explaining what the market actually cared about that morning. Inside the Charan Invests community, 35,000+ members talk through CPI mornings as they happen, including the ones where the number looked bad and stocks rallied anyway. If the mechanism side is what interests you, how the stock market works covers why prices move at all, and options expiration covers the other recurring date that makes a session behave strangely.
Keep learning
Prefer to watch? Search YouTube for "how does the CPI report affect the stock market" to see an inflation release and the market reaction walked through on a chart.
This article is educational content only and is not financial advice. Investing involves risk, including the possible loss of capital.
Frequently Asked Questions
The Consumer Price Index report is a monthly release from the Bureau of Labor Statistics measuring the average change in prices paid by urban consumers for a basket of goods and services, including food, housing, energy, transport and medical care. It is reported as a month over month change and a year over year change, and it is the most widely watched measure of US consumer inflation.
Because the market trades the surprise rather than the level. Forecasts are published ahead of each release and current prices already reflect the expected outcome, so a reading that is still historically high but came in below what was expected removes a worry and can lift stocks. The gap between consensus and the actual print is what moves prices.
Headline CPI includes everything in the basket. Core CPI excludes food and energy, whose prices swing sharply on weather, harvests and geopolitics and often reverse within months. Core is treated as the better guide to the underlying trend, so when the two readings disagree the market usually pays closer attention to core.
Controlling inflation is part of the Federal Reserve's mandate, so inflation data shapes what the market expects the Fed to do with rates. Rate expectations set bond yields, and yields determine how much a dollar of future company profit is worth today. Higher expected rates shrink the present value of distant earnings, which is why fast-growing companies tend to react most sharply.
CPI comes out monthly, twelve times a year, each release covering the previous month, and it lands in the morning before the US market opens. Check the Bureau of Labor Statistics news release schedule at bls.gov for the exact upcoming dates rather than a third-party calendar, because copied dates go stale.
Apply it live
Learn with 35,000+ beginners
Every lesson gets discussed live in the free Discord. Bring your questions and learn from real market moves.
Join Free Discord →Explore VIP