
Educational content only. Not financial advice. Always do your own research. See full Disclaimer.
Open any chart and you will notice something odd. Price keeps stalling in the same neighborhoods. It runs up, gets rejected near 182, falls back, finds buyers near 168, and does it again a month later. Those repeat zones are support and resistance, and they are the closest thing technical analysis has to a foundation. Almost every other tool sits on top of them.
The problem is that support and resistance is also the easiest concept to do badly. Draw enough lines on a chart and one of them will be near price at all times, which feels like insight and is actually noise. This guide is about the opposite habit: finding the two or three levels that genuinely matter on a stock, ranking them, and building a trade around them with a stop that makes sense.
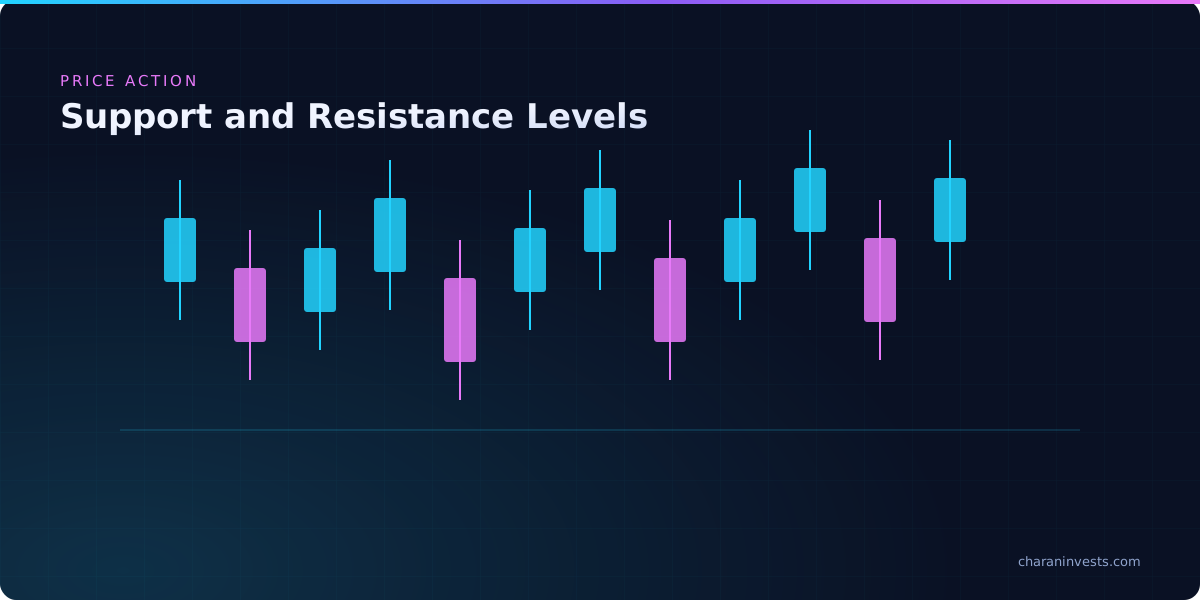
What a level really is: a record of where people traded
A support level is not magic and it is not a law of physics. It is a record. At 168, a lot of shares changed hands. Buyers who bought there feel good about that price and are willing to buy more. Sellers who sold there watched price run away and would like a second chance. Traders who missed the move have that number stuck in their head as "cheap." When price returns, all three groups act at once, and their orders show up as a pause or a bounce.
Resistance is the same story with the roles reversed. At 182, buyers who paid up got trapped and want out at breakeven. Holders take profits. New sellers see a spot where the stock failed before. Supply overwhelms demand and price stalls.
That framing matters, because it tells you when a level should be respected and when it should be ignored. A level built on heavy trading and an obvious reaction carries weight. A random wick from a quiet Tuesday does not. You are looking for evidence that a lot of people made decisions at a price, not for a line that touches a few candles.
Draw zones, not hairlines
The single fastest upgrade to most people's charting is to stop drawing precise lines. Price does not reverse at 168.00 because 168.00 is special. It reverses somewhere in the 167 to 169 area, and where exactly depends on the day.
Use a rectangle instead of a line. Start it at the body cluster where price repeatedly closed, and extend it to include the wicks that poked through. That gives you a zone with a top and a bottom, which is far more useful than a hairline for two reasons. It stops you from calling a level "broken" when price dips a few cents past your line, and it gives you a defined area where your trade idea is either working or wrong.
If you are still building the basics of chart layout, timeframes, and volume, read how to read a stock chart first. Zones make a lot more sense once the rest of the chart is familiar.
Where the levels come from
You do not need an indicator to find these. Scan for the following, in roughly this order of usefulness.
- Swing highs and swing lows. The obvious turning points where a move ended and reversed. These are the backbone of every level you will draw.
- Areas with multiple touches. A zone price has visited three times and rejected each time is stronger evidence than one it touched once.
- The edges of a range. When a stock chops sideways for weeks, the top and bottom of that box become the two prices everyone is watching.
- Prior gaps. When a stock jumps overnight and leaves a gap on the chart, the gap edges often act as levels later because very little trading happened inside them.
- Round numbers. 50, 100, 200. Not because they are mathematically meaningful, but because orders and option strikes cluster there.
- Big-volume days. The high and low of an unusual volume day (an earnings reaction, a news event) tend to matter for months.
Keep it to a handful. If your chart has more than four or five zones on the timeframe you trade, you are looking at noise and you will end up justifying whatever you already wanted to do.
Ranking a level: which one wins
Not all zones are equal, and knowing which one outranks the others is what separates a plan from a guess. Four things raise a level's importance.
Timeframe. A weekly level beats a daily level, and a daily level beats a 5-minute one. If you are day trading and price is approaching a zone that has held on the weekly chart for two years, that zone is the boss of your chart no matter what your intraday setup says.
Number of reactions. Two clean touches with a real reaction each time is a genuine level. One touch is a hypothesis.
Volume at the level. If the reactions came with a surge in volume, real money defended that area. If price drifted through on light volume, the level is soft.
Recency. A zone that mattered last month is more relevant than one from three years ago. The traders with positions and memories at that price are still around.
The strongest levels are the ones you can see without drawing anything. If you need to squint to find it, the market is not watching it either.
Role reversal: old resistance becomes new support
Here is the behavior that makes levels genuinely tradeable. When price finally breaks through resistance and holds above it, that zone often turns into support on the way back down. Broken support does the same in reverse and becomes a ceiling.
The logic follows from the record-of-decisions idea. Once buyers who were trapped at 182 finally get out at breakeven, the sellers there are gone. Meanwhile the traders who bought the breakout now see 182 as their line in the sand, and they will defend it or bail if it fails. The composition of who owns what at that price changed, so the level's behavior changed with it.
Watching for this flip is more reliable than chasing the breakout itself, which is the next thing worth getting right.
Breakouts, retests, and the false break
A breakout is price closing decisively beyond a zone, ideally on volume that is clearly above average. The word doing the work there is "closing." An intraday poke through the top of a zone that closes back inside is not a breakout, it is a failed test, and it often marks the exact top of the move.
Buying the instant a level breaks is the most common way traders get chopped up, because a large share of breaks fail. Price pushes past the level, triggers the stop orders sitting just beyond it, and immediately reverses. You get filled at the highest price of the day and stopped out an hour later.
The alternative is to wait for the retest. After a real breakout, price usually pulls back to the level it just cleared. If that old resistance now holds as support, you have three things you did not have before: confirmation the flip happened, a much better entry price, and an obvious place to put your stop (just below the zone). You will miss the moves that never look back. That is a fair price for skipping most false breakouts.
Candles at the retest give you extra information. A long lower wick, a bullish engulfing candle, or a tight consolidation right on the zone all suggest buyers are defending it. A heavy close back through it suggests the breakout was a trap. Our guide to candlestick patterns covers what those shapes are telling you.
Turning a level into an actual trade
A level by itself is not a trade. A trade needs an entry, an invalidation point, and a target, and levels give you all three.
Entry. Either at the zone (buying support, selling resistance, betting the range holds) or after a breakout and retest (betting the range is over). Pick one before price gets there. Deciding in the moment means deciding emotionally.
Stop. Below the bottom of a support zone, not inside it. If you buy at 168 and put your stop at 167.90, you are not managing risk, you are donating to whoever is running stops. Give the zone room to be messy, then accept that a close well below it means your idea was wrong.
Target. The next level up. That is the honest answer. If support is at 168 and the next real resistance is at 182, your realistic target is somewhere just under 182, because that is where sellers showed up last time.
Now do the arithmetic before you enter. Entry 169, stop 166, target 181 gives you three dollars of risk for twelve of reward. That is a trade worth taking. If the next level is only two dollars up and your stop is three dollars down, the setup is real but the trade is not. Position size comes from the same math, and risk management and position sizing is where that gets nailed down properly.
Common mistakes with support and resistance
- Drawing too many levels. Ten zones on one chart guarantees price is always "at a level," which means the concept has told you nothing.
- Treating a level as a wall. Levels are areas of increased odds, not guarantees. Plenty of them break, and that is normal.
- Ignoring the trend. Buying support in a stock that is making lower highs and lower lows means each level you buy is the next one to break. Levels work best when they agree with the direction the stock is already going.
- Putting the stop where everyone else does. Just below an obvious low is exactly where liquidity sits and exactly where price often pokes before reversing.
- Redrawing levels after the fact. If you move your zone to explain what price just did, you have stopped analyzing and started narrating.
- Forgetting the calendar. Levels mean much less through an earnings report or a Fed decision, when a single headline can reprice the whole stock. If you trade options into those events, the volatility side of it matters too, which we cover in implied volatility and IV crush.
A simple routine to practice this week
Pick three stocks you actually follow. On the daily chart, mark no more than three zones on each: the most obvious ceiling, the most obvious floor, and one in between if it earns its spot. Write down what you expect at each one, then check back in two weeks and see which zones held, which broke, and which broke and flipped.
That exercise builds the only skill that matters here, which is telling a real level from a line you drew because you wanted a reason to buy. It also makes the next layer of technical analysis easier, since indicators like RSI, trendlines, and moving averages are mostly different ways of measuring the same push and pull between buyers and sellers. If you want the wider view of how this fits with valuing the business itself, fundamental vs. technical analysis lays out both sides.
Your next step
Levels are one of those skills that improves fastest when you watch someone mark up a chart in real time and explain why they kept one zone and threw out three others. Inside the Charan Invests community, 36,000+ traders post the levels they are watching before the open and talk through what actually happened after the close. Comparing your zones to theirs on the same chart will sharpen your eye faster than any checklist. You can also read Charan's story and how the community started.
Keep learning
Prefer to watch? Search YouTube for "how to draw support and resistance levels" to see zones marked up on live charts.
This article is educational content only and is not financial advice. Trading involves risk, including the possible loss of your entire investment.
Frequently Asked Questions
Support is a price area where buying has repeatedly overwhelmed selling, so price tends to stall or bounce there. Resistance is the opposite: an area where selling has repeatedly overwhelmed buying, so price tends to stall or reverse. Both are records of where large numbers of traders made decisions before, which is why those prices keep mattering.
Four things make a level stronger: it appears on a higher timeframe such as the weekly chart, price has reacted to it more than once, the reactions came with above-average volume, and it formed recently rather than years ago. A level that meets several of those is worth building a trade around. A single touch on a 5-minute chart is not.
Because the mix of who owns shares at that price changes. Once a level breaks and the trapped sellers there have exited, the remaining traders are mostly buyers who bought the breakout and now defend that price. Their orders turn the old ceiling into a floor, which is why a retest of a broken level is a common entry point.
Below the entire support zone, not just under your entry or a few cents under the low. Levels are areas rather than exact prices, and stops placed at the obvious low are the ones most likely to get triggered on a brief poke before price reverses. Size the position so that a stop at that wider distance still risks only a small, planned percentage of your account.
Apply it live
Learn with 36,000+ beginners
Every lesson gets discussed live in the free Discord. Bring your questions and learn from real market moves.
Join Free Discord →Explore VIP